性能分析工具
 Before you start optimizing anything, you should first evaluate the current performance and identify the bottlenecks of your application.在着手优化之前,你首先需要评估当前性能并确定应用程序的性能瓶颈。
Evaluating the application performance, or profiling it, is an important part of the development process. Every time you make any significant changes or additions to your project, you need to check how they affect the application's operation speed. After optimization, it is also important to perform profiling again to evaluate whether the performance metrics have improved.性能评估(或称性能剖析)是开发流程中的重要环节。每当你对项目进行重大修改或添加新内容时,都需要检查这些变更对应用程序运行速度的影响。完成优化后,同样需要再次进行性能剖析以验证优化效果。
UNIGINE has two main tools for evaluating application performance — performance Profiler and the Microprofile tool.UNIGINE提供两大核心性能评估工具:性能分析器(Profiler)和微剖析工具(Microprofile)。
Let's review them in detail.下面我们将详细介绍这两款工具。
Profiler性能分析器(Profiler)#
Profiler provides general performance information such as the amount of allocated memory, number of triangles, shaders, and rendering calls. With its help, you can also evaluate which operations take the most time and decide whether you need to optimize your application's content and logic.性能分析器提供全局性能数据,包括内存分配量、三角形数量、着色器数量以及渲染调用次数等。通过该工具,你可以评估最耗时的操作环节,进而判断是否需要优化应用程序内容或逻辑。
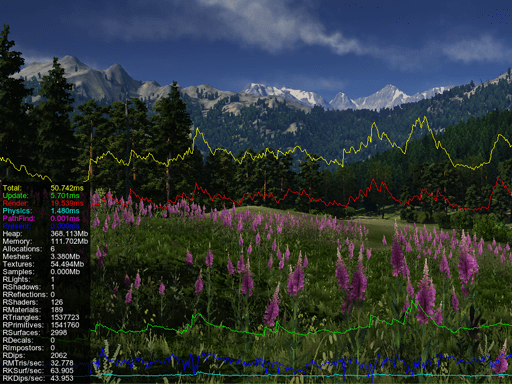
Profiler displays performance data on a timeline. It shows how much time in each frame was spent on updating all the components of your project: how long it took to render nodes, update their states, execute game logic, calculate physics, and so on.该工具采用时间轴形式展示性能数据,直观呈现每帧画面中各个项目组件的更新时间占比:包括节点渲染耗时、状态更新耗时、游戏逻辑执行耗时、物理计算耗时等。
For the most performance-consuming operations, such as rendering and calculation of physical interactions, graphs are displayed on the screen. They clearly show the moments of performance drops (so-called spikes), based on which you can identify all bottlenecks.针对渲染和物理交互计算等高消耗操作,屏幕会实时显示对应的性能曲线图。这些图表能清晰呈现性能骤降点(即所谓的"性能尖峰"),帮助你准确定位所有性能瓶颈。
To turn on the profiler, click Tools -> Performance Profiler in the main menu of UnigineEditor and choose the required profiling mode.要启用性能分析器,请在UnigineEditor主菜单中点击Tools -> Performance Profiler(工具→性能分析器),然后选择所需的剖析模式。
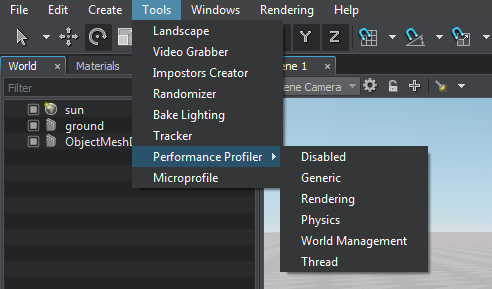
Depending on the selected mode, the set of displayed data will differ:根据所选模式的不同,显示的数据集也有所差异:
- Generic profiler shows the general statistics block only. It includes such indicators as total time taken to calculate and render the current frame, time spent on updating the application logic, GPU waiting time, CPU rendering time, GUI rendering time, physics calculations, allocated memory size, as well as the number of synchronous and asynchronous threads. This general statistics block is available in all profiling modes.Generic profiler(通用分析器)仅显示基础统计模块。包含以下指标:当前帧计算与渲染总耗时、应用逻辑更新耗时、GPU等待时间、CPU渲染时间、GUI渲染时间、物理计算耗时、内存分配量,以及同步/异步线程数量。该基础统计模块在所有剖析模式中均可查看。
- Rendering profiler shows the detailed rendering statistics and the timeline chart.Rendering profiler(渲染分析器)显示详细的渲染统计数据及时间轴图表。
- Physics profiler shows the detailed physics-related statistics (within the Physics radius) and the timeline chart.Physics profiler(物理分析器)展示物理相关详细统计(在Physics radius范围内)及对应时间轴图表。
- World Management profiler shows the statistics on the currently loaded virtual world: total number of nodes, physical bodies, and joints, as well as time spent on procedural content creation (e.g. grass and clutters).World Management profiler(世界管理分析器)提供当前加载虚拟世界的统计数据:节点总数、物理体数量、关节数量,以及程序化内容生成耗时(如草地和植被群)。
- Thread profiler shows the statistics on loading threaded resources: time of asynchronous loading of resources, sounds, as well as asynchronous pathfinding calculations.Thread profiler(线程分析器)显示线程资源加载统计:资源异步加载耗时、声音加载耗时,以及异步寻路计算耗时。
As you can see, there are quite a lot of indicators, so we offer you some tips that may help you to interpret some general statistics values from the Generic profiler:如你所见,性能指标相当丰富,因此我们提供以下解读通用分析器(Generic profiler)基础统计值的建议:
- A high value of the Update indicator may imply that you need to optimize the part of your application logic that is executed every frame. Or it may mean that you need to reduce the number of objects in the scene the state of which is updated every frame (e.g. particle systems, or meshes with skeletal animation).Update指标过高可能意味着需要优化每帧执行的应用程序逻辑,或是需要减少场景中每帧更新状态的对象数量(例如粒子系统或带骨骼动画的网格)。
- A high Render CPU value signals that you need to optimize your content. For example, adjust LODs for objects with a large number of polygons, and reduce the number of polygons in models if possible.Render CPU值偏高提示需要优化内容:例如为高多边形对象调整LOD层级,尽可能减少模型多边形数量。
-
The Waiting GPU indicator shows the time between the completion of all calculations on the CPU side and the completion of frame rendering on the GPU side, so it should be used to analyze your application's bottlenecks.Waiting GPU指标反映CPU端完成所有计算到GPU端完成帧渲染之间的时间间隔,可用于分析性能瓶颈
- A zero value means that it takes longer to compute a frame on the CPU than it does to render a frame on the GPU, which means that there is a bottleneck on the CPU.零值表示CPU帧计算耗时超过GPU帧渲染耗时,说明存在CPU瓶颈
- If the value is high, you should check the frame rate (FPS): if it is low, then the GPU is the limiting factor (i.e. GPU computation is much slower than CPU computation); if it is high enough, then the CPU has free resources that should be used to process more operations in the Update cycle.若该值较高,需检查帧率(FPS):若帧率较低则GPU是限制因素(GPU计算远慢于CPU);若帧率足够高,则说明CPU有闲置资源可用于处理更多Update循环中的操作
- A continuous increase in the Memory indicator value may indicate a memory leak. In this case, you should check whether all created objects and variables are correctly deleted after they are used.Memory指标持续增长可能预示内存泄漏,此时应检查所有创建的对象和变量在使用后是否正确释放
The values of the Generic Profiler indicators are also displayed on the graphs, so you can clearly see which of them have changed dramatically at a certain point in time and then analyze their values. The colors of the graph and the corresponding indicator coincide. For example, a spike in the red graph indicates an increase in the Render GPU value, which in turn means that there is "heavy" content in the scene that requires optimization.通用分析器的各项指标值会同步显示在曲线图中,你能直观看到特定时间点哪些指标发生突变。曲线颜色与对应指标颜色一致,例如红色曲线出现峰值表示Render GPU值上升,即场景中存在需要优化的"重型"内容。
Working with Microprofile使用Microprofile工具#
Microprofile is a tool for collecting and analyzing CPU and GPU performance data that allows you to carry out a detailed frame-by-frame inspection of your application performance.Microprofile是一款用于收集和分析CPU与GPU性能数据的工具,可对应用程序性能进行逐帧详细检测。
Microprofile can profile up to 1000 frames. It displays performance data on a local web server with the ability to save it as an HTML file.Microprofile最多可分析1000帧数据。它通过本地Web服务器展示性能数据,并支持将数据保存为HTML文件。
The Microprofile tool is only available for Development builds of the engine: it is not compiled for Debug and Release builds.该工具仅适用于引擎的Development版本(Debug和Release版本不包含此功能)。
You can check if Microprofile is enabled and turn it on using the microprofile_info console command. If it is disabled, you will need to change project settings in UNIGINE SDK Browser and restart the application:你可以通过microprofile_info控制台命令检查Microprofile是否启用并进行开关。若未启用,需在UNIGINE SDK Browser中修改项目设置并重启应用程序:
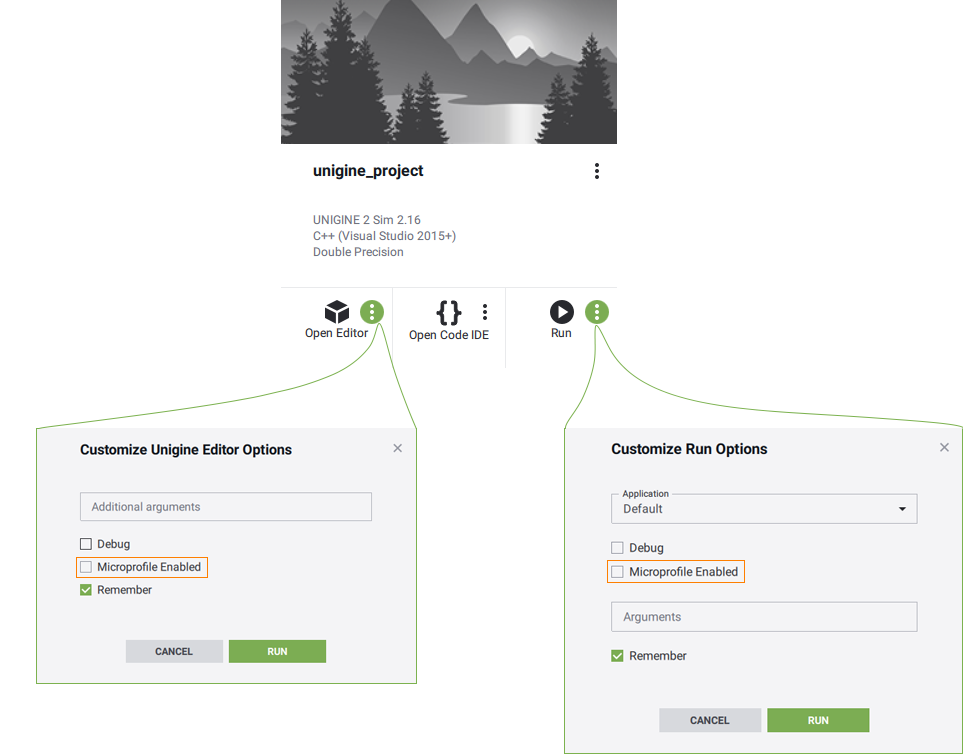
Microprofile should only be enabled when you are working with it. If you do not use performance profiling at a certain stage of working with your project, disable this tool.仅在需要使用Microprofile时开启。在项目开发的某些阶段若无需性能分析,请关闭此工具。
Visualization Using Built-In Server内置服务器可视化#
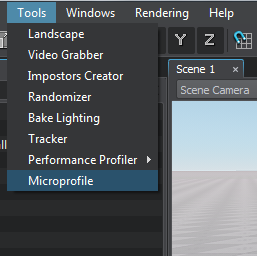
The Microprofile tool has a web interface that displays performance data. To open the profiling results in a web browser select Tools → Microprofile in the UnigineEditor main menu. The default duration of the profiled segment is 200 frames, if necessary you can change the number of frames using the microprofile_webserver_frames console command.Microprofile提供基于Web界面的性能数据显示。要查看分析结果,请在UnigineEditor主菜单中选择Tools → Microprofile。默认分析200帧数据,如需修改可通过microprofile_webserver_frames控制台命令调整帧数。
The performance data will be displayed in your web browser. Microprofile will be available via the link in the address bar while the application is running.性能数据将在浏览器中显示。应用程序运行期间,可通过地址栏链接访问Microprofile。
In the address bar, you can also limit the number of displayed frames using “/”: if you set localhost:1337/100, only the first 100 frames will be displayed.在地址栏中可使用"/"限制显示帧数:例如输入localhost:1337/100将仅显示前100帧数据。
Performance data性能数据#
Microprofile visualizes the detailed per frame performance data on operations performed by the engine on CPU and GPU and in the engine threads.Microprofile可视化引擎在CPU、GPU及引擎线程上执行操作的每帧详细性能数据。
The Microprofile tool requires a Warmup of 1000 frames at startup for the displayed information to be valid. This can take 16 to 30 seconds.Microprofile工具启动时需要1000帧的预热(Warmup),所显示的信息才能有效。这可能需要16到30秒时间。There are several modes for displaying performance data. You can switch between them in the Microprofile main menu: click Mode and select the desired one. The Detailed mode is set as a default one, as it provides the exhaustive information.性能数据显示有几种模式。你可以在Microprofile主菜单中切换:点击Mode并选择所需模式。默认设置为Detailed模式,该模式提供最详尽的信息。
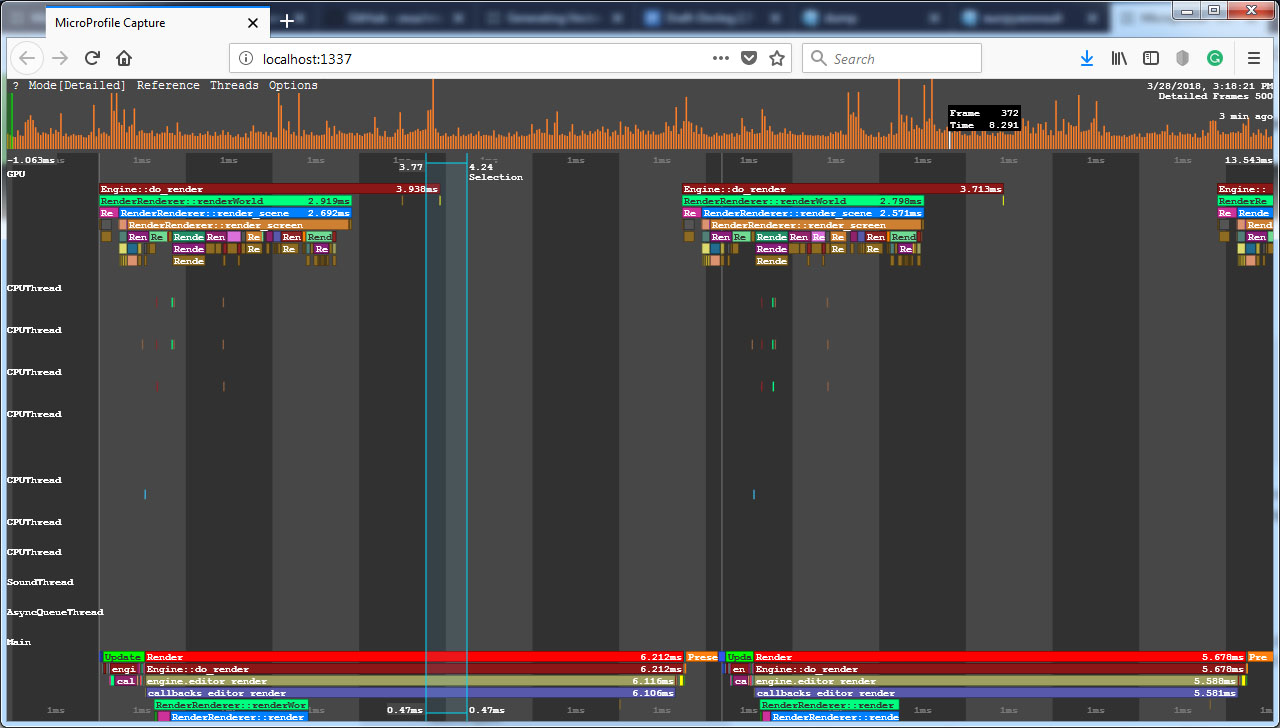
In this mode, the interface is divided into two parts:在此模式下,界面分为两部分:
- Main workspace that contains detailed information about each rendered frame. Each operation (function) and thread is displayed as a separate colored region. The regions are hierarchical: the function is a parent to the function that it calls and is displayed above it. The size of the region is determined by the time the corresponding operation takes. The workspace can be moved and scaled.主工作区包含每帧渲染的详细信息。每个操作(函数)和线程都显示为独立的彩色区域。这些区域具有层级结构:调用其他函数的函数作为父级显示在上方。区域大小由对应操作的耗时决定。工作区可移动和缩放。
- Frame sequence that is used to easily navigate through the collected data. Each column is a frame. The column height corresponds to the frame rendering time. If you click on a column, you will quickly switch to the data collected on that frame. The last frames in the sequence provide the most valuable data for performance evaluation.帧序列用于便捷浏览收集的数据。每列代表一帧,列高对应帧渲染时间。点击某列可快速切换到该帧收集的数据。序列末尾的帧对性能评估最具参考价值。
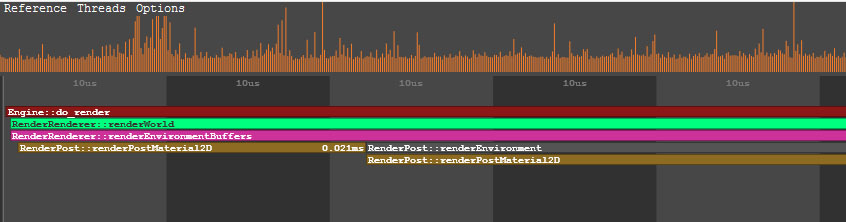
Performance data is displayed horizontally in several threads:性能数据在多个线程上水平显示:
- GPU thread shows the call stack of the operations performed by the engine on GPU.GPU线程显示引擎在GPU上执行的操作调用栈。
- Main engine thread show the call stack of the operations (such as update, rendering, etc.) performed on the CPU side.主引擎线程(Main)显示CPU端执行的操作(如update、rendering等)调用栈。
- Other engine threads (CPUThread, SoundThread, AsyncQueueThread, WorldSpawnMeshClutterThread, WorldSpawnGrassThread).其他引擎线程(CPUThread, SoundThread, AsyncQueueThread, WorldSpawnMeshClutterThread, WorldSpawnGrassThread)。
Each frame starts from the update() function.每帧都从update()函数开始执行。
Profiling Custom Code剖析自定义代码#
You can use the Microprofile to inspect performance of your application logic.你可以使用Microprofile来检查应用程序逻辑的性能。
Let's review a simple example. Suppose you have a C++ component that moves a node in the scene and enables/disables it depending on its position in the current frame.让我们看一个简单例子。假设你有一个C++组件,它根据当前帧中的位置移动场景节点并启用/禁用该节点。
To find out how long it takes to execute such logic, you can use the Profiler class methods:要了解执行此类逻辑所需的时间,你可以使用Profiler类方法:
-
At the beginning of the update() method call Profiler::begin(). Specify the counter name that will be displayed in Micropofile as its argument. At the end of the method call Profiler::end().在update()方法开头调用Profiler::begin()。将其参数指定为将在Micropofile中显示的计数器名称。在方法结尾调用Profiler::end()。NodeUpdate.h
#pragma once #include <UnigineComponentSystem.h> class NodeUpdate : public Unigine::ComponentBase { public: // 为我们的类声明构造函数和析构函数,并定义与该组件关联的属性名称 // 首次运行应用程序后,包含以下所有参数的Fan.prop文件将在项目的data文件夹中生成 COMPONENT_DEFINE(NodeUpdate, ComponentBase); // 注册要在世界逻辑相应阶段调用的方法(方法在下面的protected部分声明) COMPONENT_UPDATE(update); protected: // 声明要在世界逻辑相应阶段调用的方法 void update(); };NodeUpdate.cpp#include "NodeUpdate.h" #include<UnigineProfiler.h> #include<UnigineGame.h> REGISTER_COMPONENT(NodeUpdate); using namespace Unigine; using namespace Math; // 组件每帧调用的update方法 void NodeUpdate::update() { // 开始性能分析 Profiler::begin("NodeUpdate Component"); float time = Game::getTime(); Vec3 pos = Vec3(Math::sin(time) * 2.0f, Math::cos(time) * 2.0f, 0.0f); // 修改节点的启用标志 node->setEnabled(pos.x > 0.0f || pos.y > 0.0f); // 修改节点的世界坐标位置 node->setWorldPosition(pos); // 结束性能分析 Profiler::end(); } -
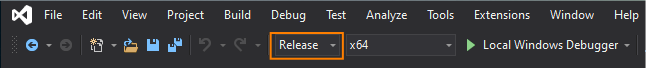
Build and run the Release version of the project by selecting the Release configuration (see the image below for MS Visual Studio) and hit Ctrl + F5.通过选择Release配置(如下图所示为MS Visual Studio界面)构建并运行项目的Release版本,然后按Ctrl + F5启动。
- Run the microprofile_enabled 1 console command, if Microprofiler hasn't been enabled via SDK Browser yet.执行microprofile_enabled 1控制台命令(若尚未通过SDK Browser启用Microprofiler)。
- Open Microprofile in the web browser.在网页浏览器中打开Microprofile。
-
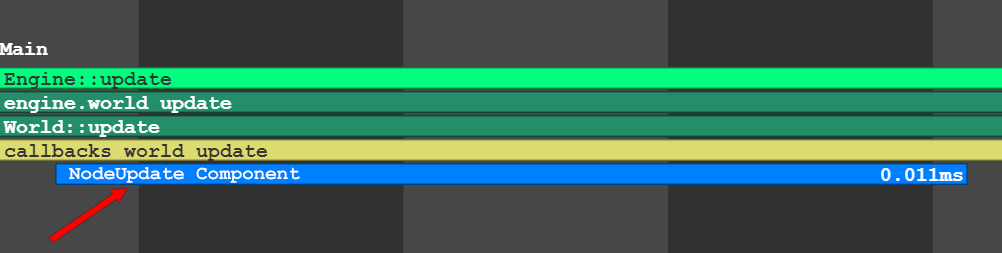
Find the region with the name you passed to the Profiler::begin() function. In our example that is "NodeUpdate Component".查找与你传入Profiler::begin()函数的名称对应的区域(本示例中为"NodeUpdate Component")。
 The Profiler::begin() and Profiler::end() functions make the code snippet available to both Profiler and Microprofile. If you want to use only Microprofile, use the Profiler::beginMicro() and Profiler::endMicro() functions. Note that their calls are different: Profiler::beginMicro() returns an identifier to be passed to Profiler::endMicro().Profiler::begin()和Profiler::end()函数使代码片段同时适用于Profiler和Microprofile。若需仅使用Microprofile,请改用Profiler::beginMicro()和Profiler::endMicro()函数。注意其调用方式不同:Profiler::beginMicro()需将返回的标识符传入Profiler::endMicro()。源代码 (C++)
int NodeUpdate::update()
{
		// 开始性能分析
		int id = Profiler::beginMicro("Component Update");

		float time = Game::getTime();
		Vec3 pos = Vec3(Math::sin(time) * 2.0f, Math::cos(time) * 2.0f, 0.0f);
		// 修改节点启用状态标志
		node->setEnabled(pos.x > 0.0f || pos.y > 0.0f);
		// 修改节点世界坐标位置
		node->setWorldPosition(pos);

		// 结束性能分析
		Profiler::endMicro(id);

	return 1;
}
本页面上的信息适用于 UNIGINE 2.20 SDK.